The first observance of Labor Day is believed to have been a parade on September 5, 1882, in New York City, probably organized by Peter J. McGuire, a Carpenters and Joiners Union secretary. About 20,000 attendees picnicked, smoked cigars, and listened to speeches by the union leadership in Union Square.
Labor Day USA - time to hit the beach.
By 1893, more than half the states were observing a "Labor Day" on one day or another, and a bill to establish a federal holiday was passed by Congress in 1894.
President Grover Cleveland signed the bill soon afterward, designating the first Monday in September as Labor Day.
Today, Americans by the millions celebrate Labor Day with a day off at backyard barbecues or with coastal celebrations at US beaches,
Millions more will opt to take advantage of great end-of-season savings at Labor Day sales at local shopping malls coast to coast.
Of course, it's still a serious fashion faux pas to wear white after Labor Day. No one knows why, or how it got started, but white is out with the last fling of summer.
AND, finally.... are you ready for some football?
With the season reving up in September, the first official NFL Kickoff game is always played on the first Thursday after Labor Day.
Meanwhile, enjoy the day off with some interesting facts and figures which provide a quick snapshot of what it's like working in America today...
WHO Are We Celebrating on Labor Day?
159.8 million
If you're currently holding down a job that's YOU - and you are a part of the almost 200 million Americans age 16 and over in the nation’s labor force, as of May 2017.
Salary & Wages
$51,212 and $40,742
The 2015 real median earnings for male and female full-time, year-round workers, respectively.
$7.25 per hour
The federal government mandated minimum wage. Meanwhile, some states have set minimum wage levels higher than the federal level. For example, the District of Columbia has set its minimum wage rate at $15.20 per hour, followed by Washington State at $14.49 per hour. In additiona, local municipalities may also have minimum wage rate of more than even the highest state minimum. $17.27 per hour, for example, is the minimum wage set in Seattle, Washington.
Where the Jobs Are
16.3 million
The number of wage and salary workers age 16 and over represented by a union in 2016. Among states, New York continued to have the highest union membership rate (23.6 percent), and South Carolina had the lowest rate (1.6 percent).
4.6%
The percentage of workers age 16 and over who worked at home in 2015. NOTE: Count on that percentage having grown sustanttially since that time (post-COVID) when ZOOM meetings and high-speed Internet connections made working from home a lot more popular.
Fastest Growing Jobs
108.0%
The projected percentage growth from 2014 to 2024 in the number of wind turbine service technicians (4,400 jobs in 2014) -- the projected fastest-growing occupation. The No. 2 spot is held by personal care aides which added 458,100 positions over the same time period.
Wind turbine service techniciasn, or windtechs, belong to the fastest-growing job sector in the US.
Americans worked in a variety of occupations as of 2016 (with a vast majority of them as frontline workers during the recent pandemic.)
Largest Occupations, May 2016
Number of Employees
Retail salespersons
4,528,550
Cashiers
3,541,010
Combined food preparation and serving workers, including fast food
3,426,090
Office clerks, general
2,955,550
Registered nurses
2,857,180
Customer service representatives
2,707,040
Laborers and freight, stock and material movers, hand
2,587,900
Waiters and waitresses
2,564,610
Secretaries and administrative assistants
2,295,510
General and operations managers
2,188,870
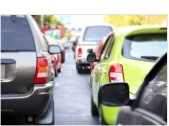
The
Long and Winding Road to Work
26.4 minutes The average time it took workers in the United States to commute to work in 2015. New York (33.1 minutes) and Maryland (32.6 minutes) had the most time-consuming commutes.
76.6%
The percentage of workers age 16 and over who drove alone to work in 2015. Another 9.0 percent carpooled and 0.6 percent biked to work.
6.5 million
The number of commuters who left for work between midnight and 4:59 a.m. in 2015. They represented 4.6 percent of all commuters. The most common time was between 7 a.m. and 7:29 a.m. — with 20.9 million commuters.

 WHO Are We Celebrating on Labor Day?
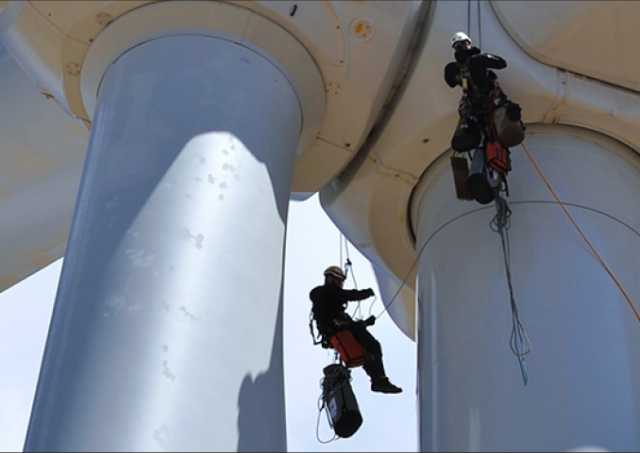
 The average time it took workers in the United States to commute to work in 2015. New York (33.1 minutes) and Maryland (32.6 minutes) had the most time-consuming commutes.